Intro #
Multi-tenant mode will enable you to physically separate metrics from sources into different folders and treat them independently one from another. This gives additional layer of isolation between different teams or orgs and additional flexibility to set retention period or other handling rules.
My system is running in Mac Air M1, Docker Desktop (k8s)
Install Helms #
# Grafana Helm includes Mimir and Grafana
# use: grafana/mimir-distributed and grafana/grafana
#
helm repo add grafana https://grafana.github.io/helm-charts
helm repo update
Configure Mimir #
Use minimal setup to run in the local Kubernetes cluster (Docker Desktop or Rancher Desktop).
# Do not use this configuration in production.
# It is for demonstration purposes only.
multitenancy_enabled: true
mimir:
  structuredConfig:
    tenant_federation:
      enabled: true

compactor:
  sharding_ring:
    kvstore:
      store: memberlist

distributor:
  ring:
    instance_addr: 127.0.0.1
    kvstore:
      store: memberlist

ingester:
  ring:
    instance_addr: 127.0.0.1
    kvstore:
      store: memberlist
    replication_factor: 1

# Disable zone-aware replication
ingester:
  replicas: 1                    # <-- reduce from default 3
  zoneAwareReplication:
    enabled: false               # <-- disables zone-a/b/c splitting
  persistentVolume:
    enabled: false

store_gateway:
  zoneAwareReplication:
    enabled: false

# Disable MinIO (you're using filesystem backend)
minio:
  enabled: true

# Disable all microservice replicas (set to 0)
distributor:
  replicas: 1
querier:
  replicas: 1
query_frontend:
  replicas: 1
query_scheduler:
  replicas: 1
ruler:
  replicas: 0
compactor:
  replicas: 0
store_gateway:
  replicas: 0
alertmanager:
  replicas: 0
overrides_exporter:
  replicas: 0

# Enable the monolithic "all" target
enterprise_metrics:
  enabled: false

rollout_operator:
  enabled: false
Install helm using:
helm install mimir grafana/mimir-distributed -f values.yaml -n o11y --create-namespace
Configure Grafana #
Install Grafana with default values, just for testing. There will be no persistance, so all changes will be lost on restart.
helm install grafana grafana/grafana -n grafana --create-namespace
Then, add Mimir datasource:
# Prometheus Datasource

# Url
http://mimir-gateway.o11y.svc.cluster.local/prometheus
In authentication section, add Header:
X-Scope-OrgID: tenant-1|tenant-2
Test Tenants #
Configure your sources, eg. Otel Collectors to insert X-Scope-OrgID header with value set to tenant-1 or tenant-2. Or use curl for simple testing to send metrics from 2 tenants.
#!/bin/bash
OTLP_SERVER=127.0.0.1

# Mimir OTLP
OTLP_ENDPOINT="http://$OTLP_SERVER:9090/otlp/v1/metrics"

# Check how many args
if [ $# -ne 2 ]; then
	echo "Usage: $0 <metric_name> <number>"
	exit 1
else
	METRIC_NAME=$1
	METRIC_VALUE=$2
	echo "Sending to: "$OTLP_ENDPOINT
fi

# Get the current Unix timestamp in nanoseconds
CURRENT_TIME=$(date +%s)000000000

# Define the payload with a metric value of 142
PAYLOAD=$(cat <<EOF
{
  "resource_metrics": [
    {
      "resource": {
        "attributes": [
          { "key": "service.name", "value": { "string_value": "test-service-11" } }
        ]
      },
      "scope_metrics": [
        {
          "metrics": [
            {
              "name": "$METRIC_NAME",
              "description": "A simple test metric",
              "unit": "1",
              "gauge": {
                "dataPoints": [
                  {
			"asDouble": $METRIC_VALUE,
                    	"timeUnixNano": "$CURRENT_TIME",
			"attributes": [
			{
				"key": "host.name",
				"value": {
					"string_value": "o11y"
				}
			},
			{
				"key": "service.name",
				"value": {
					"string_value": "o11y_srvc"
				}
			}
			]
                  }
                ]
              }
            }
          ]
        }
      ]
    }
  ]
}
EOF
)

# Send the payload via curl
curl -X POST $OTLP_ENDPOINT \
  -H "X-Scope-OrgID: tenant-1" \
  -H "Content-Type: application/json" \
  --data-raw "$PAYLOAD"

echo
echo "Metric name should be: "$METRIC_NAME"_ratio"
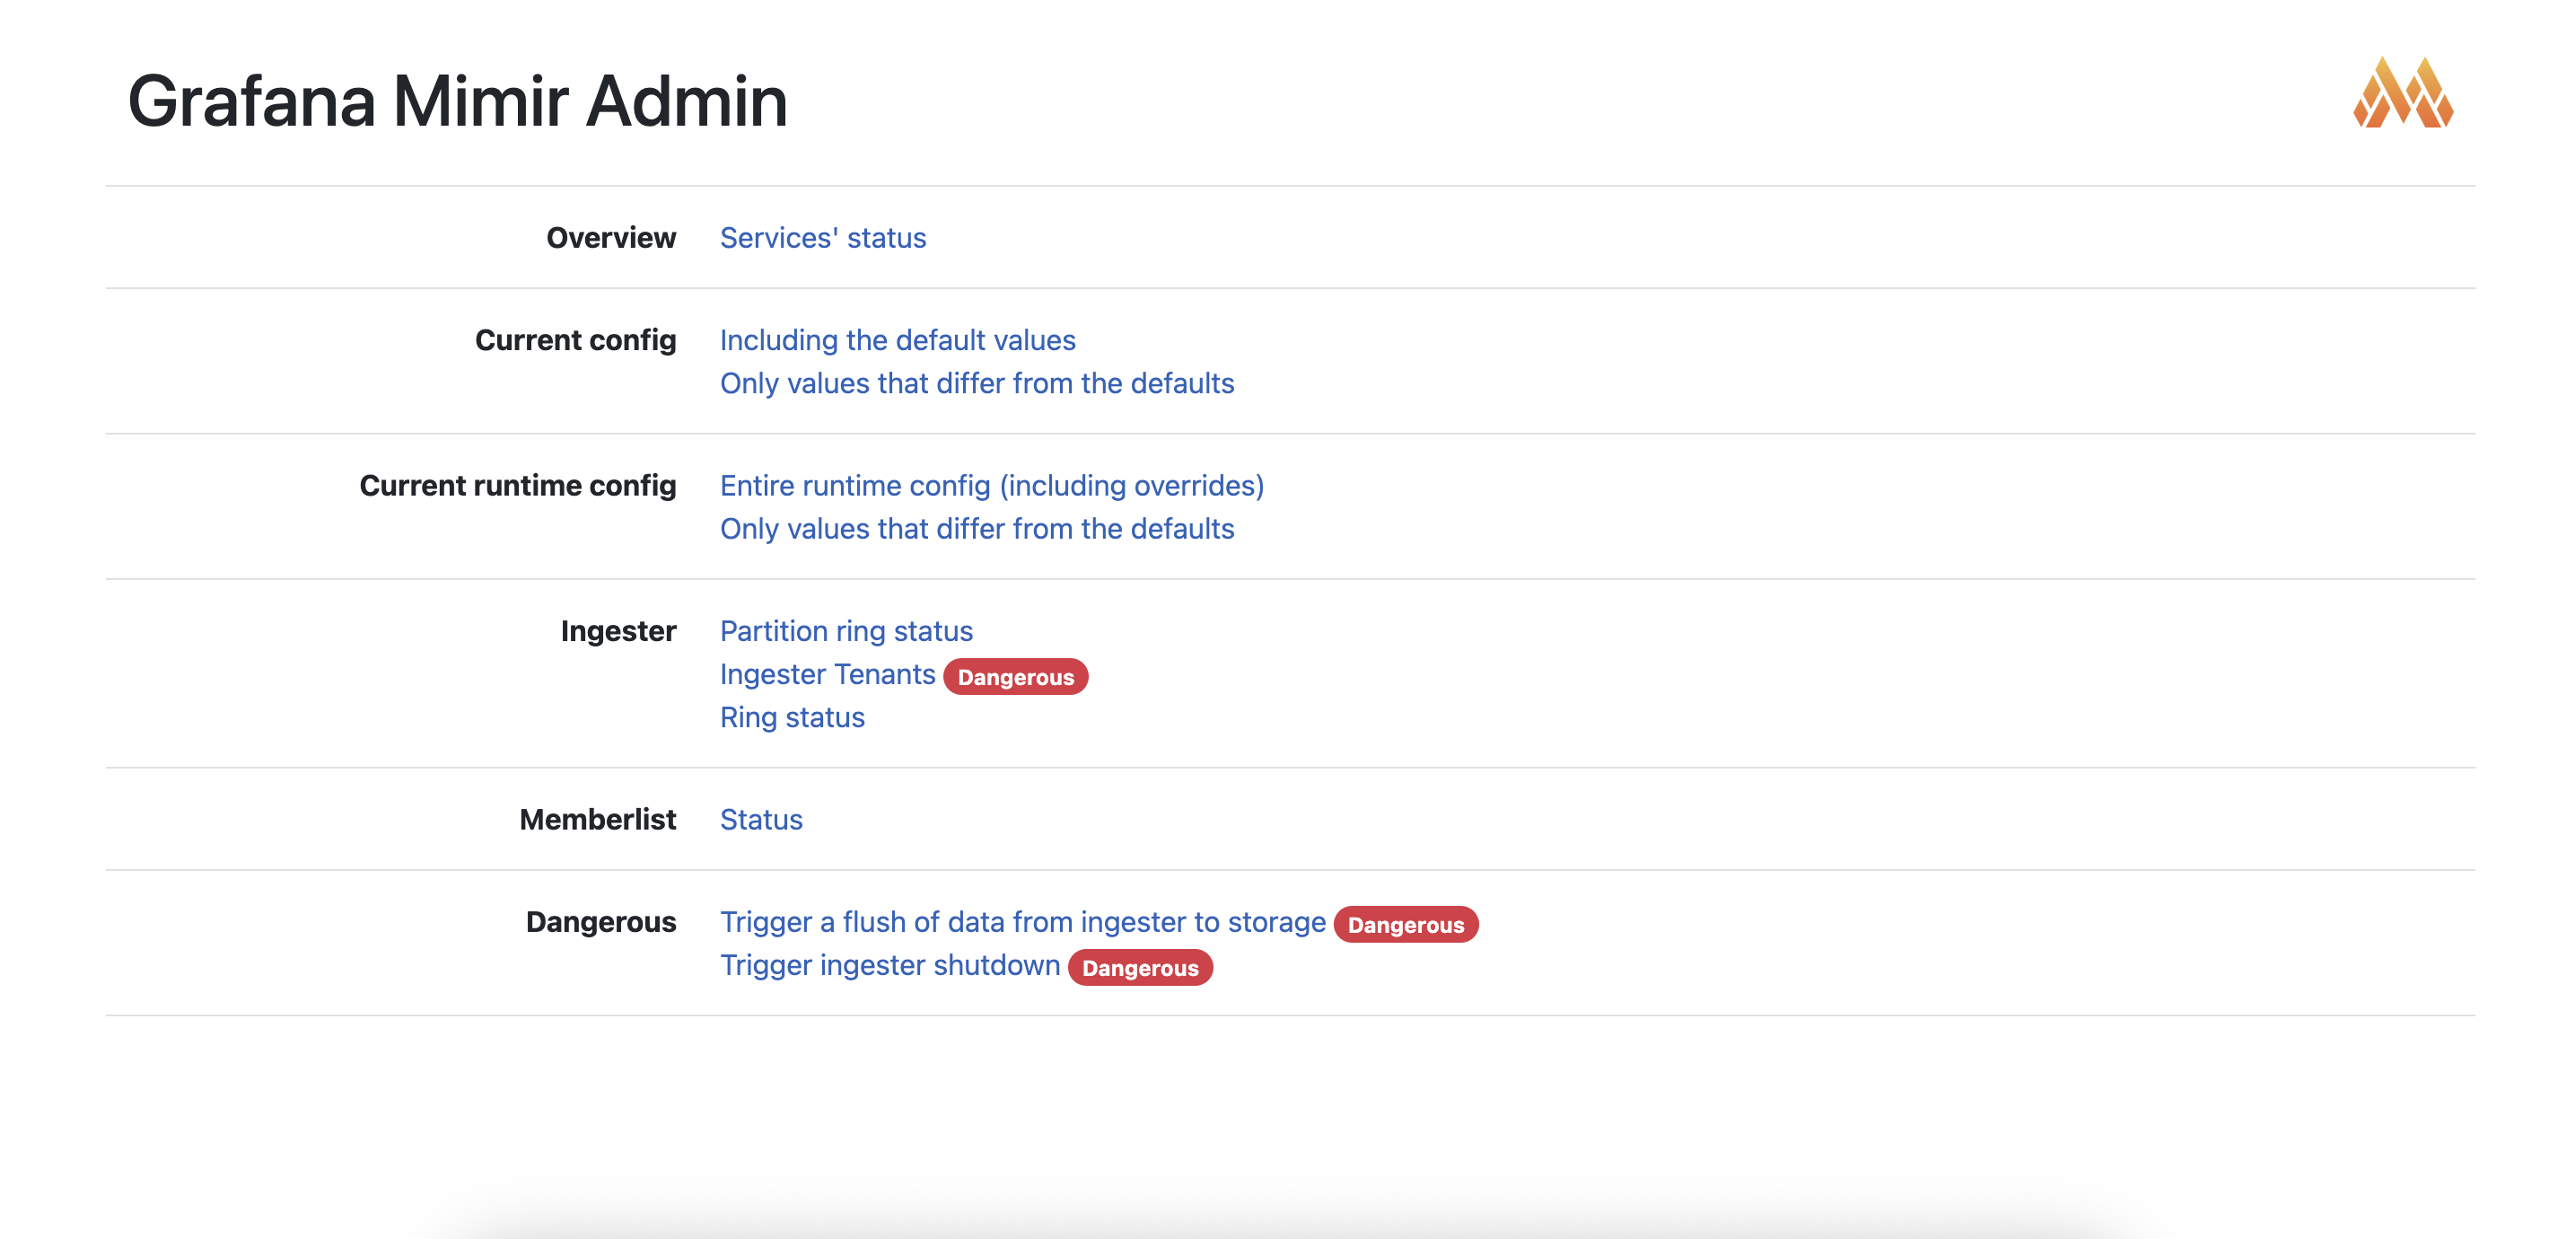
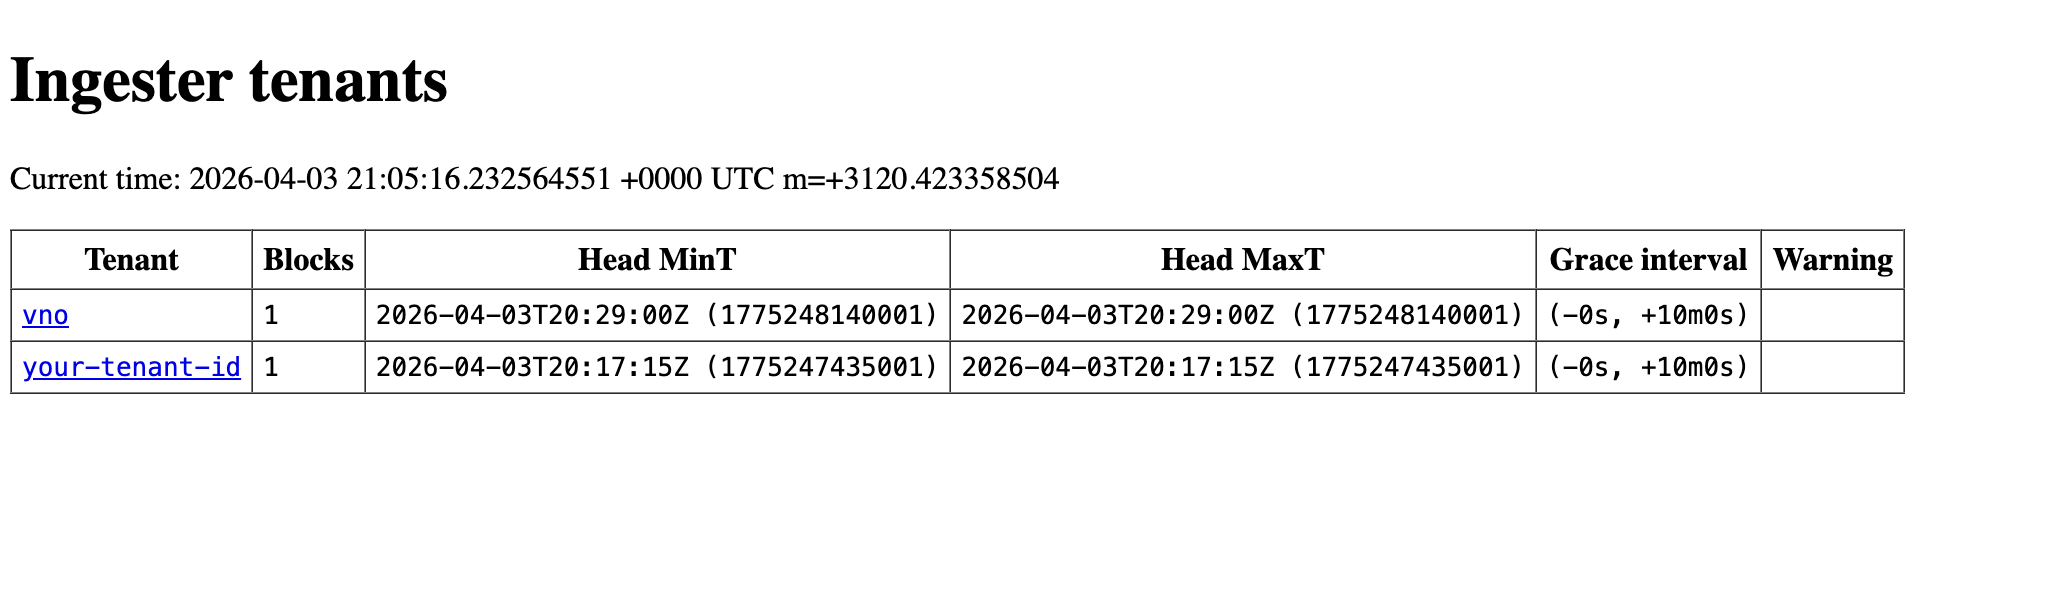
You can follow results in the ingester UI:
Check tenants:
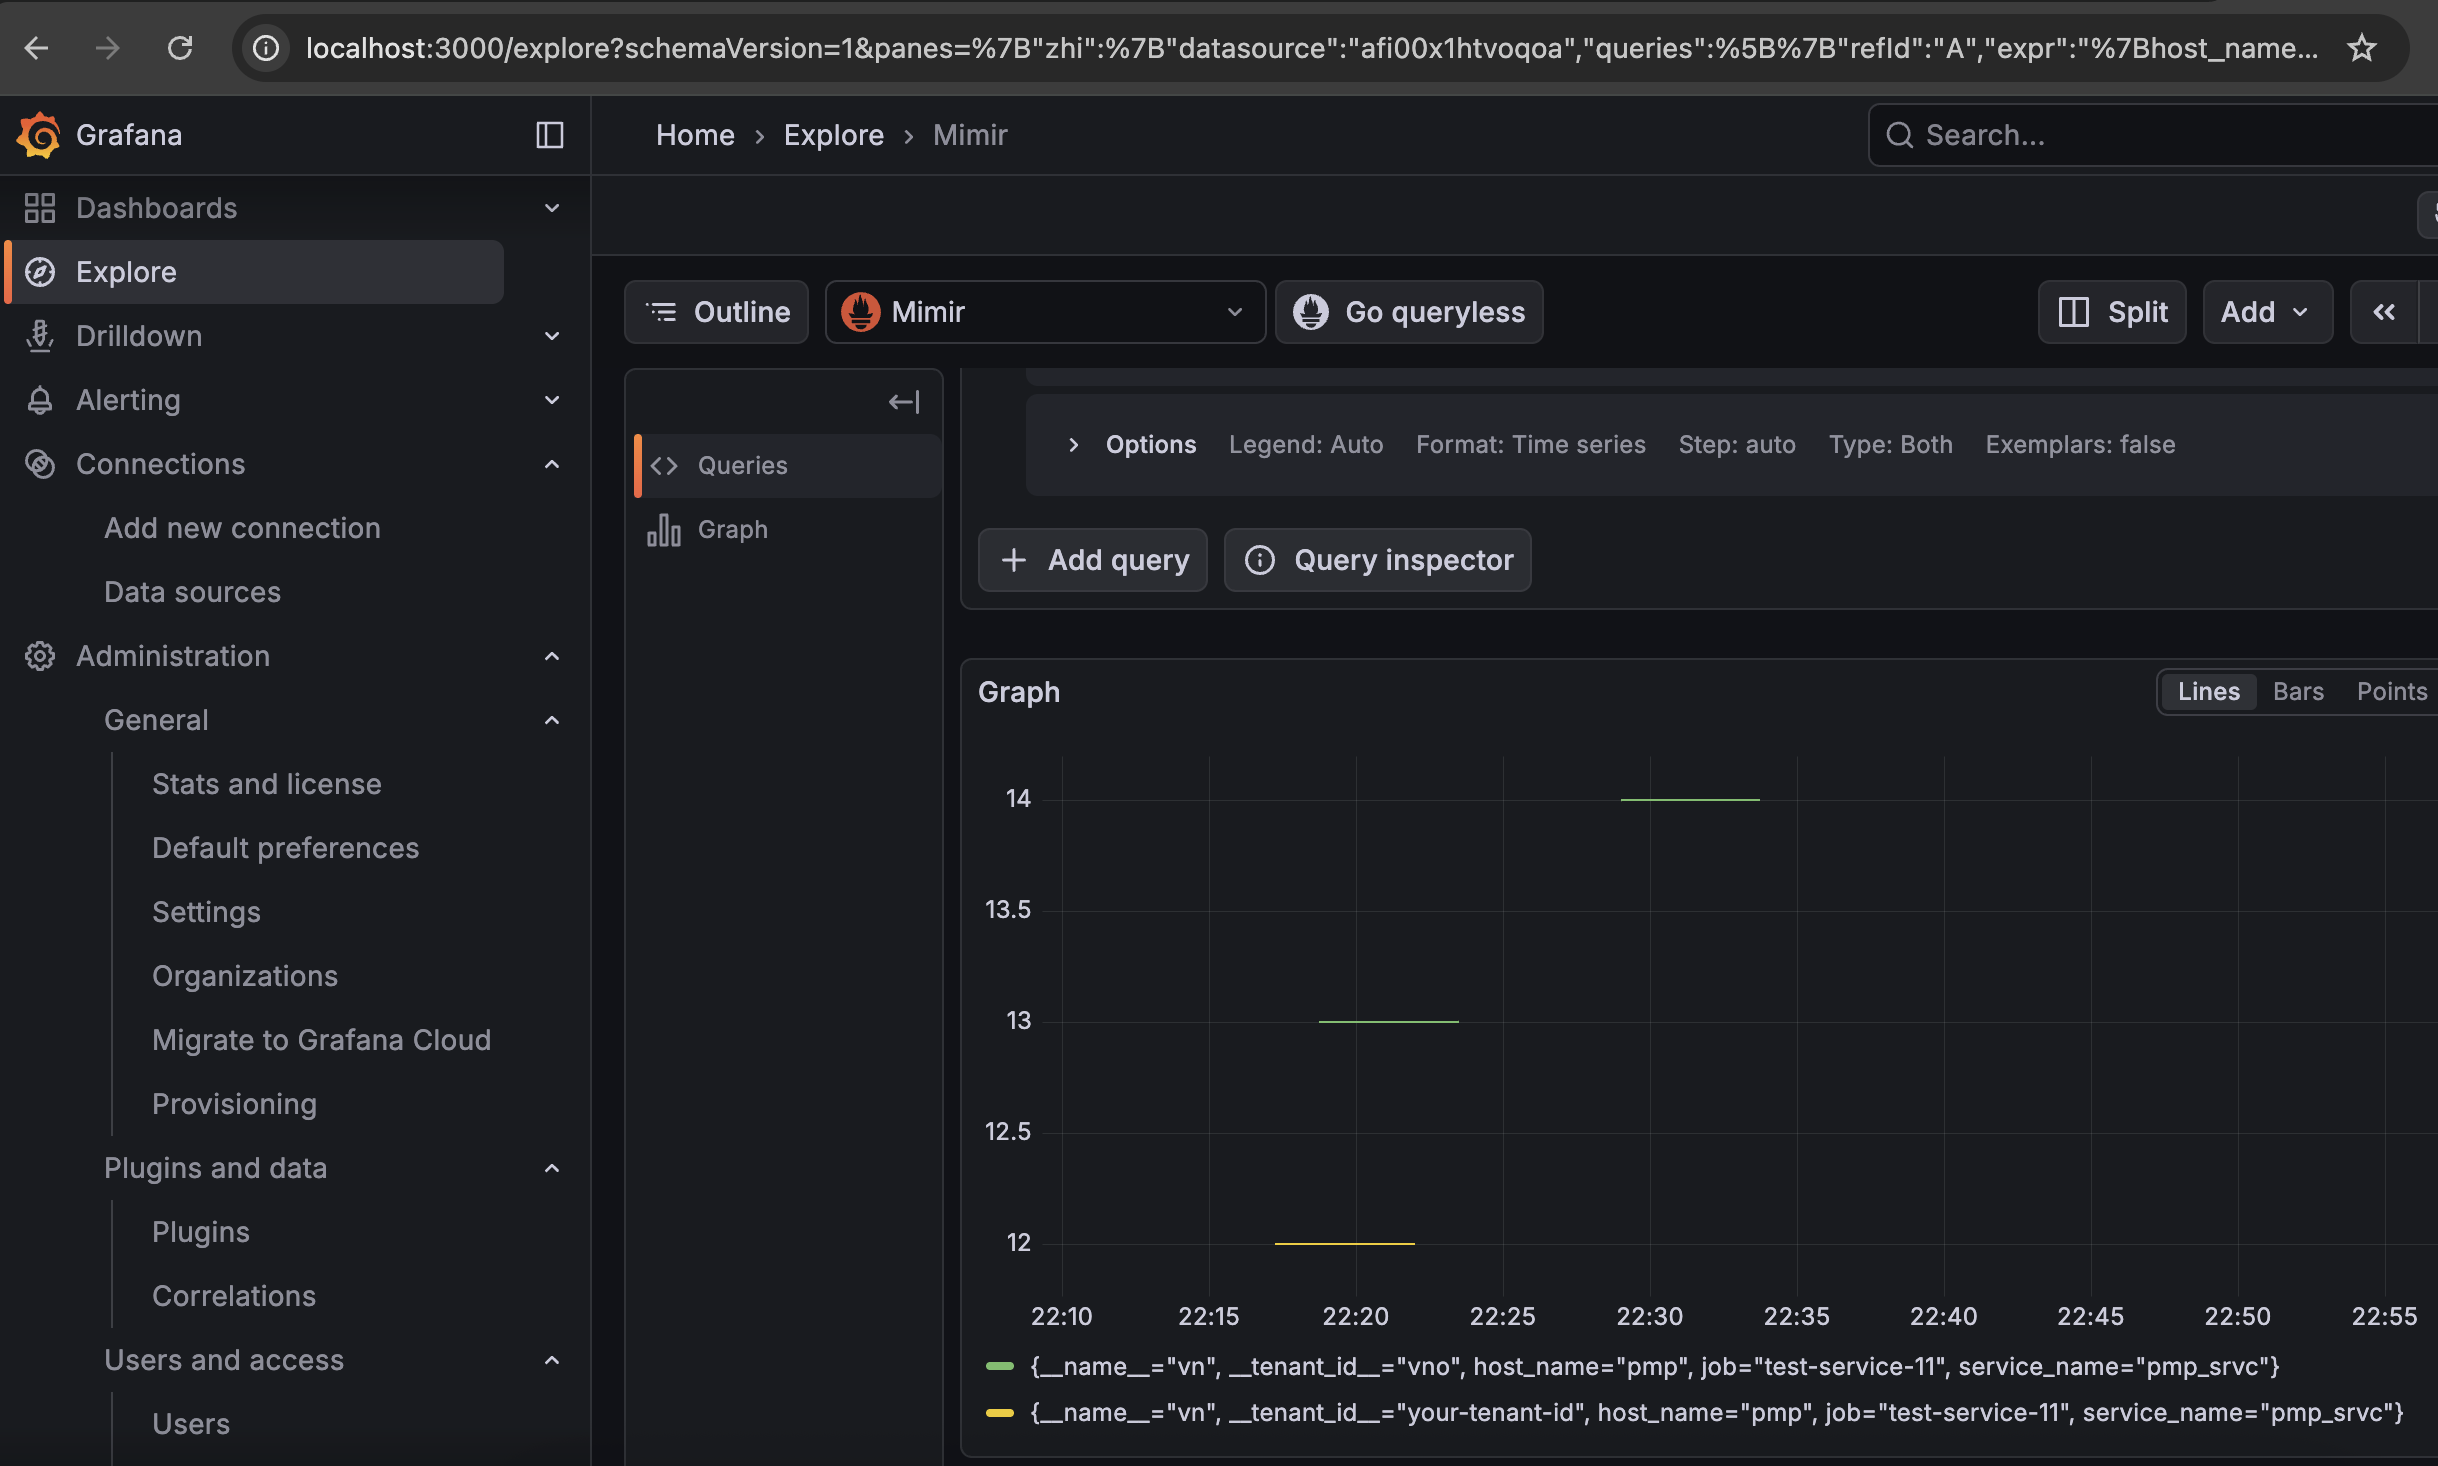
Check tenants in Grafana and verify if tenants federation works: