K8s Monitoring Servicemonitor
K8s-monitoring can use prometheus-operator CRDs to discover services for monitoring and scraping. Here are few steps to help troubleshoot your setup.
Enable Prometheus-Operator in Helm
# @section -- Features - Prometheus Operator Objects
prometheusOperatorObjects:
  # -- Enable gathering metrics from Prometheus Operator Objects.
  # @section -- Features - Prometheus Operator Objects
  enabled: true
This feature is using alloy-metrics component, so it must be enabled, too.
Deploy app with exposed metrics
I used bitnami/nginx to test the setup.
helm install ext-nginx bitnami/nginx --set metrics.enabled=true --set metrics.serviceMonitor.enabled=false -n ext-nginx --create-namespace
Create ServiceMonitor
In the namespace where your app is running, create the ServiceMonitor CRD:
apiVersion: monitoring.coreos.com/v1
kind: ServiceMonitor
metadata:
  labels:
    release: prometheus
  name: ext-nginx
  namespace: ext-nginx
spec:
  endpoints:
    - path: /metrics
      port: metrics

  namespaceSelector:
    matchNames:
      - ext-nginx
  selector:
    matchLabels:
      app.kubernetes.io/name: nginx
This has to match with configuration defined in the app service and labels must match, too.
apiVersion: v1
items:
- apiVersion: v1
  kind: Service
  metadata:
    labels:
      app.kubernetes.io/instance: ext-nginx
      app.kubernetes.io/managed-by: Helm
      app.kubernetes.io/name: nginx
      app.kubernetes.io/version: 1.29.4
      helm.sh/chart: nginx-22.4.3
    name: ext-nginx
    namespace: ext-nginx
  spec:
    ports:
    - name: http
      nodePort: 30965
      port: 80
      protocol: TCP
      targetPort: http
    - name: https
      nodePort: 30247
      port: 443
      protocol: TCP
      targetPort: https
    - name: metrics
      nodePort: 31830
      port: 9113
      protocol: TCP
      targetPort: metrics
    selector:
      app.kubernetes.io/instance: ext-nginx
      app.kubernetes.io/name: nginx
Check the setup
Alloy-Metrics logs
ts=2026-01-22T20:43:53.093176928Z level=info msg="found service monitor" component_path=/prometheus_operator_objects.feature component_id=prometheus.operator.servicemonitors.service_monitors name=ext-nginx
ts=2026-01-22T20:43:53.096953512Z level=info msg="Using pod service account via in-cluster config" component_path=/prometheus_operator_objects.feature component_id=prometheus.operator.servicemonitors.service_monitors discovery=kubernetes config=serviceMonitor/ext-nginx/ext-nginx/0
Check Alloy-Metrics UI
Alloy-Metrics is running UI on the port 12345, so port-forward and visit using browser.

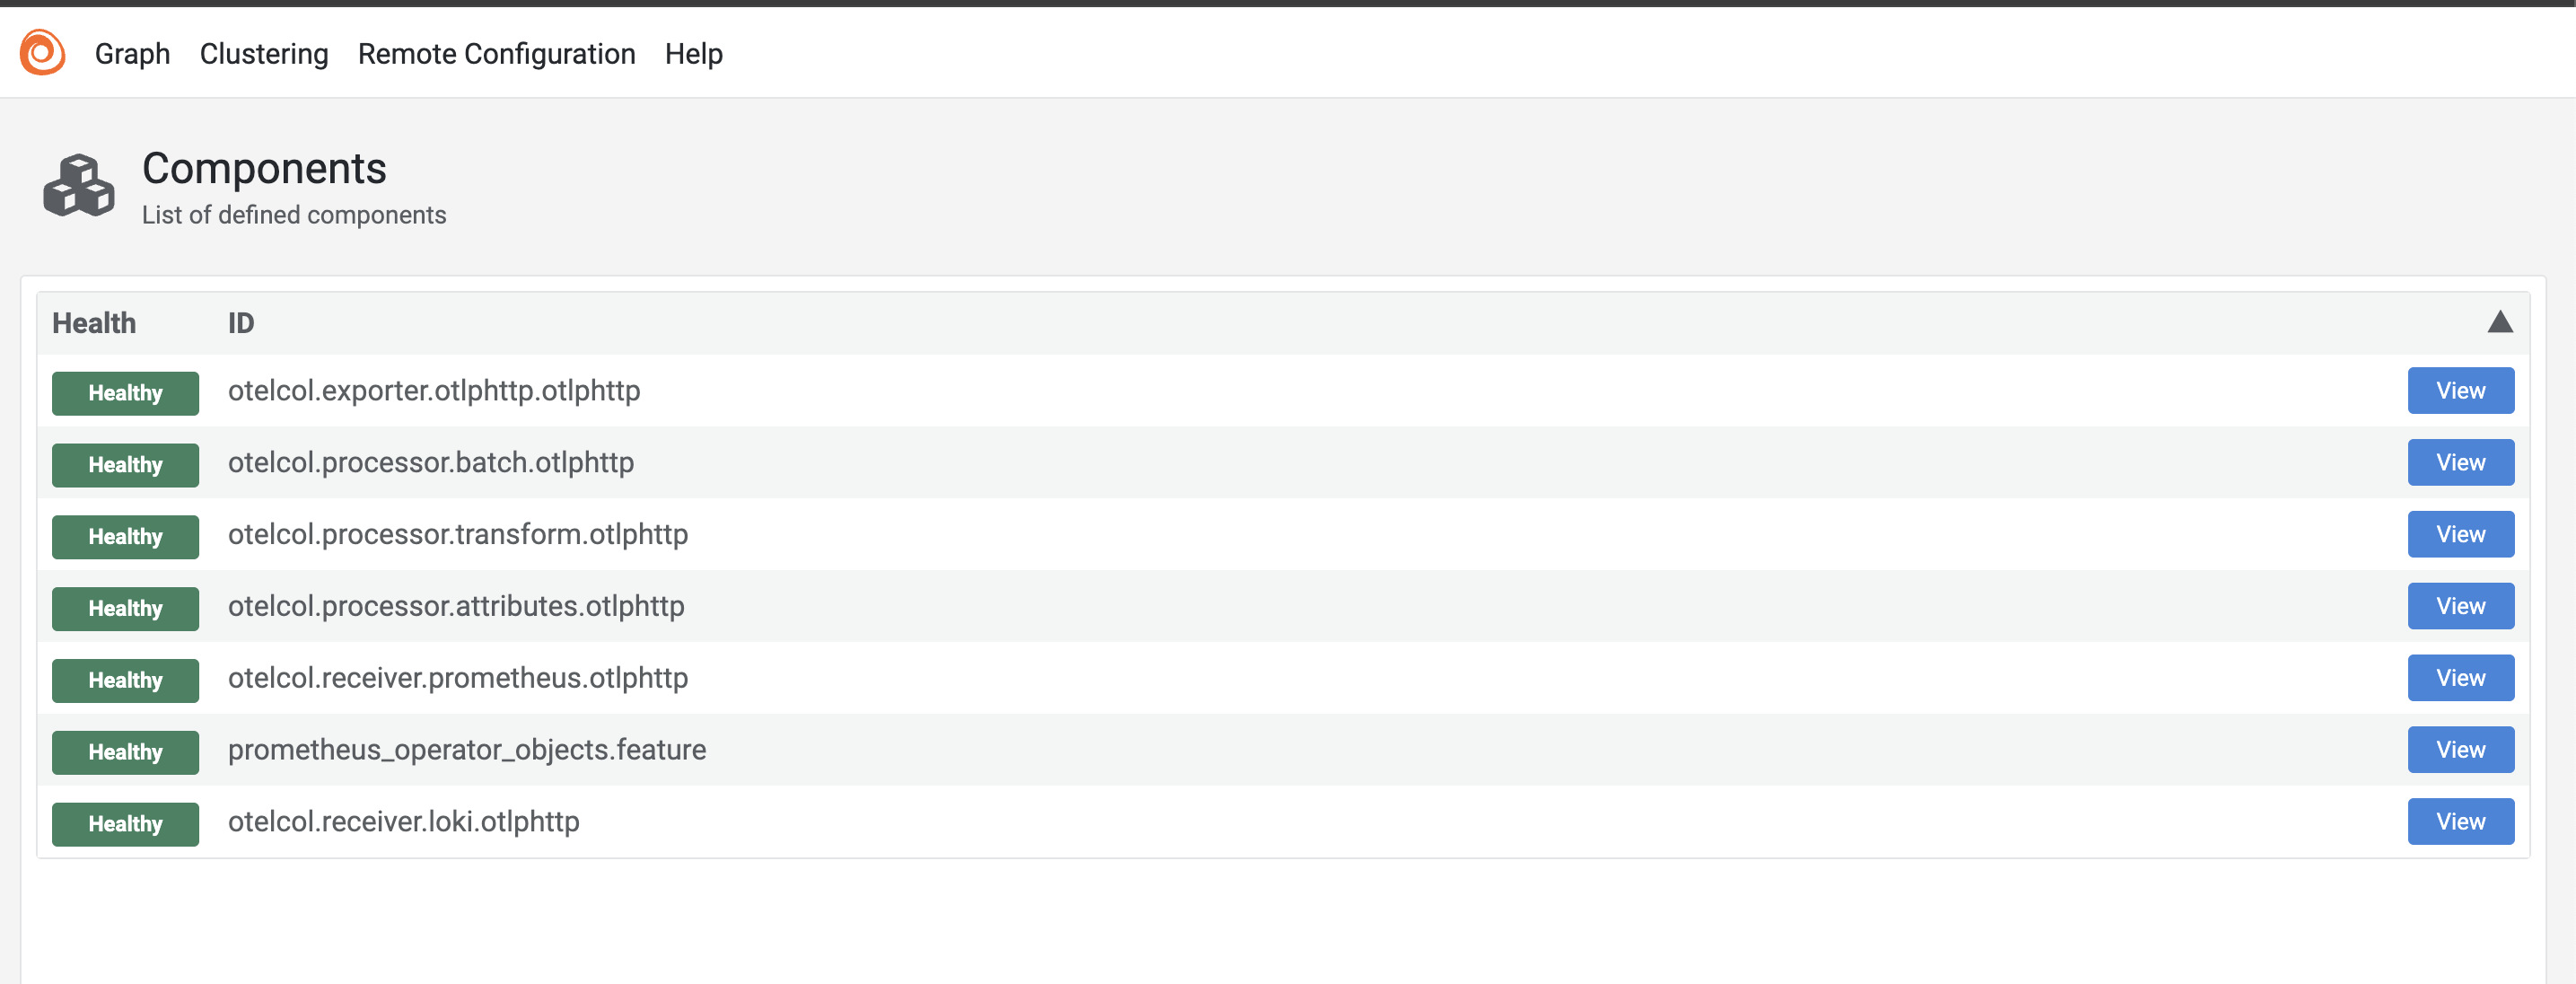
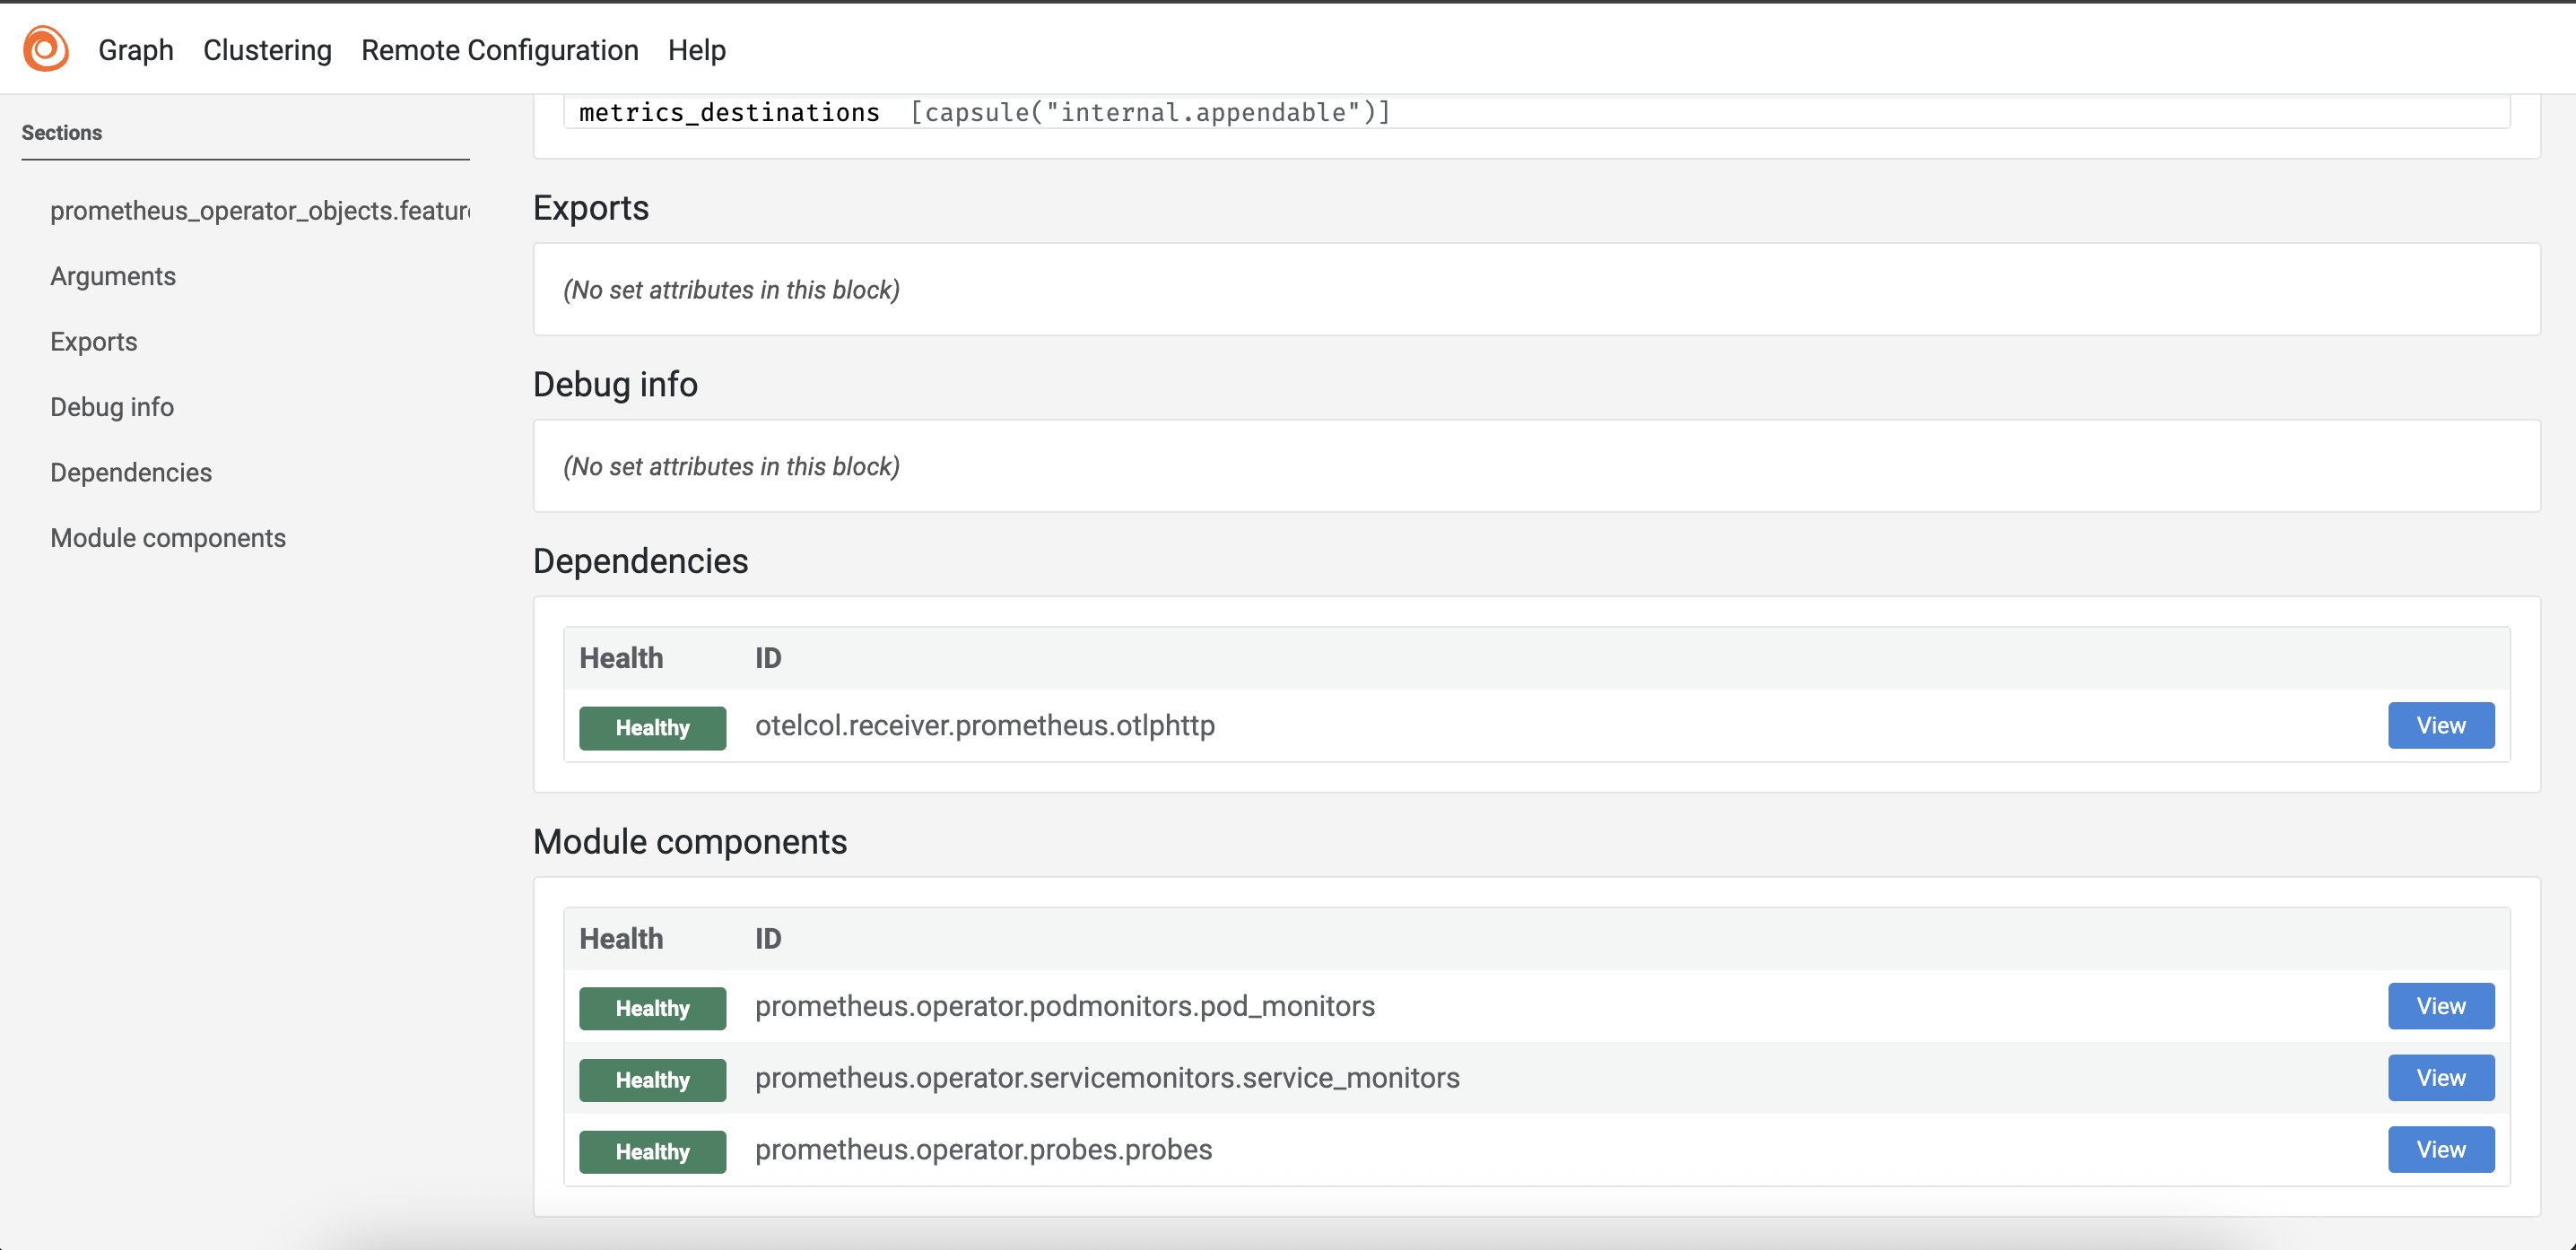
You choose prometheus_operator_objects_feature and click -> View

In the Modules section, follow prometheus.operator.servicemonitors.service_monitors -> View

Check target health:
